
Case Study: Divar Service Suggestion in Chat
Published:
Preface
Some time ago, Divar Company announced a task for the entrance interview for one of its positions, which I prepared in 4 days and sent to them. My answer to this task made me pass the first stage and reach the interview. In this post, I will explain about this task.
What is Divar?
Divar is a platform, started working on 11 July 2012 with the aim of buying and selling without online intermediaries (like Craigslist but in Iran). Now, it has over 50 milions of users and it covers various categories such as real estate, vehicles, digital goods, home and kitchen, services, entertainment and leisure, and recruitment and employment.
If we want to take a general look at Divar, something like this happens in this platform:
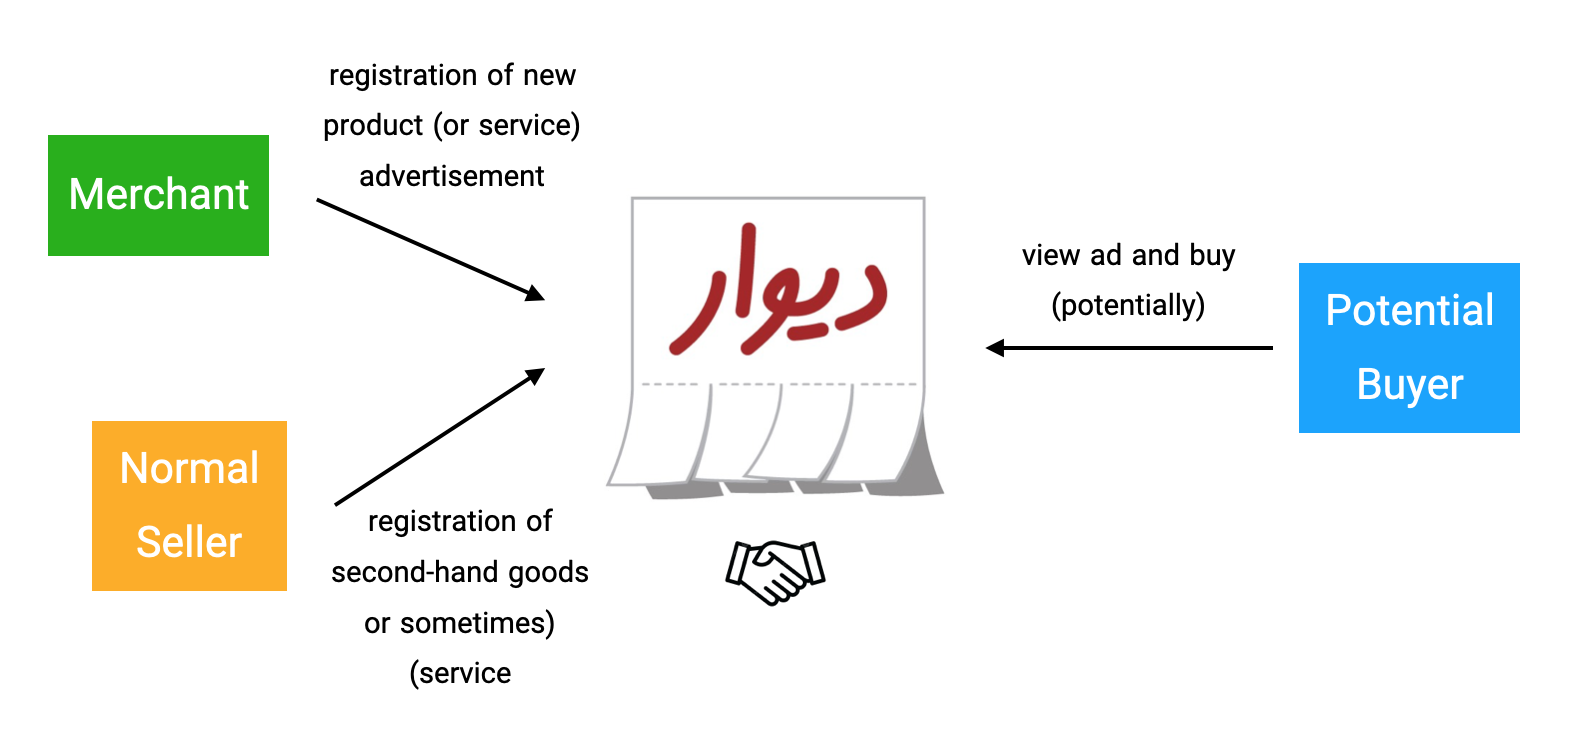
Divar - Overview
The Assignment
Problem
The interview task is as follows:
In the attached file, there is a list of users’ chats in Divar’s personal items category. Read them and write a list of your suggestions for providing the service on the Divar chat in order of priority, noting the frequency of repetition (send the tagged file along with the task answer).
Input Dataset
The attached file was a CSV file containing two columns: conversation and type. Here is the sample screenshot of it:
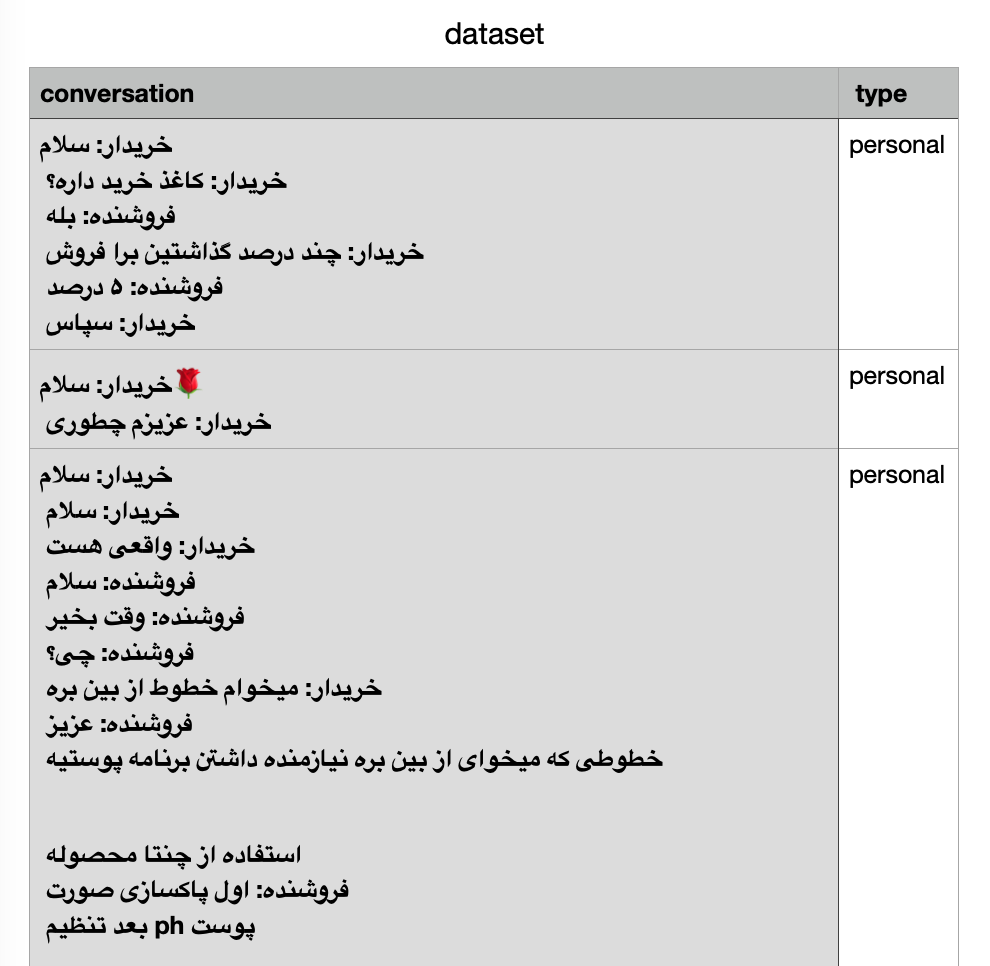
Dataset Sample
Let’s talk about the suggested solution.
Solution
First of all, i implemented a script to get the frequency of each word in the chats. If you run this code (python3 main.py), it outputs a sorted csv file (output.csv) that shows the frequency of repetition of each word. It should be mentioned that to improve the quality of the output, stop words are removed from the output. I used the data set of this address for the list of such words.
Here is the script:
# -*- coding: utf-8 -*-

import csv
from collections import Counter

######################################################################

FILE_PATH = 'dataset.csv'
STOP_WORDS_FILE = 'stop_words.txt'
OUTPUT_FILE_PATH = 'output.csv'

######################################################################

def get_stopwords(file_path):
    with open(file_path, 'r') as stopfile:
        stopwords = stopfile.read().splitlines()
    return stopwords

def count_word_frequency(file_path, stopwords):
    word_frequency = Counter()
    with open(file_path, 'r') as csvfile:
        reader = csv.DictReader(csvfile)
        for row in reader:
            conversation = row['conversation']
            words = conversation.split()
            words = [word.lower() for word in words if word.lower() not in stopwords]
            word_frequency.update(words)
    return word_frequency

def write_to_csv(output_file, word_freq):
    with open(output_file, 'w', newline='') as csvfile:
        writer = csv.writer(csvfile)
        writer.writerow(['Word', 'Frequency'])
        for word, frequency in word_freq.items():
            writer.writerow([word, frequency])

######################################################################

stop_words_list = get_stopwords(STOP_WORDS_FILE)
word_freq = count_word_frequency(FILE_PATH, stop_words_list)
sorted_word_freq = dict(sorted(word_freq.items(), key=lambda item: item[1], reverse=True))

######################################################################

write_to_csv(OUTPUT_FILE_PATH, sorted_word_freq)
print(f"Word frequency data has been written to {OUTPUT_FILE_PATH}")
The output CSV file should be something like this:
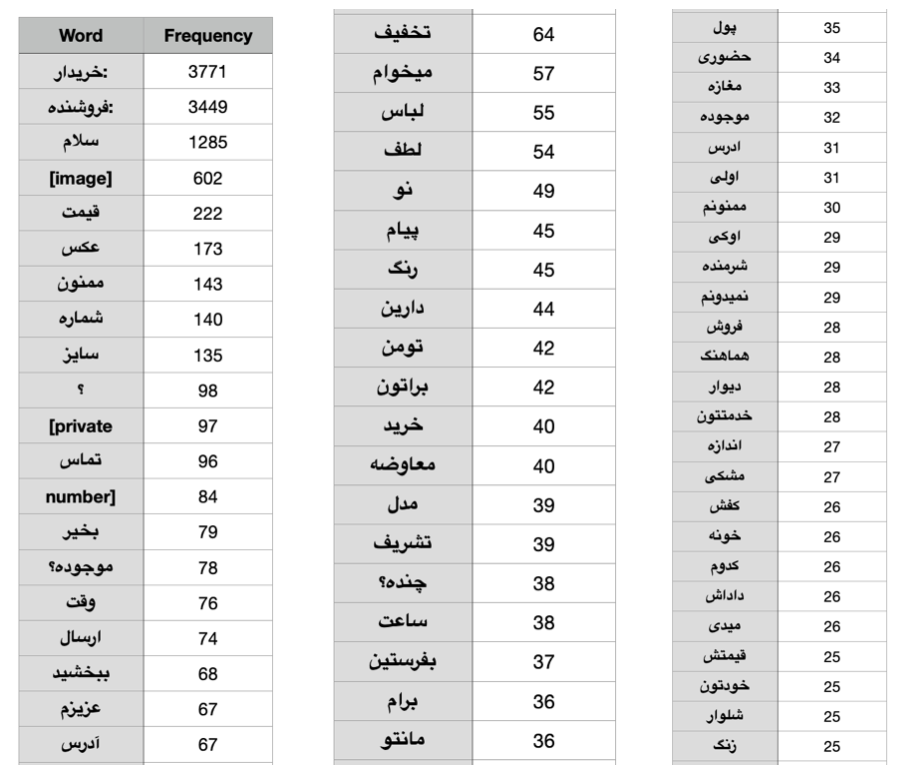
Output Sample
Suggested Services
The following table shows the suggested services based on important and frequent keywords:
| Recommended Service Title | Keywords (translated to English) |
|---|---|
| Payment (or earnest money) | Price, Discount, Toman, Money, Deposit, Card, Cost, Earnest Money, How Much?, Bill |
| Product more details view (PDP) | Size?, New, Color, Quality, Model, Available?, Black, Centimeter |
| Product Delivery | Delivery, Address, Post, Transmission, Order, City, Home, Fare |
| Ad information Completion | Price, How Much?, Size?, New, Color, Model, Size, Centimeter, Material, Height, Photo |
| Navigation | Address, In-Person, Where?, City, Town, House, Passage |
| Photo Selection (OS API) | Photo, Gallery |
| Contact the seller or buyer | Number, Contact, Phone |
| Audio to text conversion | voice |
Prioritization
The previous part was just a list of services. According to the task, we should also prioritize which is a challenging matter. I always make a simple formula to prioritize. I select N criterias. I give all of them a score from 1 to 10 (some of them need to be normalized). Then I add the average weight and the job is done. At least, if it is not true, there is some logic behind it. It’s better than gut feeling! Currently, we only have the word frequency variable in the chat here. Other variables such as business impact, technical effort, degree of dependence on each other, approximate cost of operationalization, etc. are among the things that we can consider, but since each of these requires the involvement of a high-ranking stakeholder in the organization which we dont’ have here, Therefore, we cannot use them here. So let’s go to the frequency of repeating keywords of each service and see how much they are used. Finally, the priority of implementing our services will be based on the total frequency. The output of the previous code has a defect, and that is that it calculates the frequency of similar words separately. For example, he gave a number for the word “buy” and for the word “bought” and “buying” Other frequencies, but the point is that we should consider these as one and add their frequencies together. So, I implemented a second script. If you run the merger.py code, it will create an output file named output_merged.csv that performs this merging process, and I also defined a configuration to delete those that are repeated below 20 times. In order to increase the output quality of these things in practice, Data Scientists normally use specialized libraries like NLTK and other things that I didn’t know and didn’t use them. I admit that there are some errors in the outputs, which can be ignored in the scope of this report!
Here is the merging script:
# -*- coding: utf-8 -*-

import csv

######################################################################

INPUT_FILE_PATH = 'output.csv'
OUTPUT_FILE_PATH = 'output_merged.csv'
FREQUENCY_THRESHOLD = 20

######################################################################

def merge_similar_words(input_file_path):
    word_frequency = {}
    with open(input_file_path, 'r') as csvfile:
        reader = csv.DictReader(csvfile)
        for row in reader:
            word = row['Word']
            frequency = int(row['Frequency'])
            found = False
            for key in word_frequency:
                if word in key or key in word:
                    word_frequency[key] += frequency
                    found = True
                    break
            if not found:
                word_frequency[word] = frequency
    return word_frequency

def write_to_csv(output_file, word_freq):
    with open(output_file, 'w', newline='') as csvfile:
        writer = csv.writer(csvfile)
        writer.writerow(['Word', 'Frequency'])
        for word, frequency in word_freq.items():
            writer.writerow([word, frequency])

######################################################################

merged_word_freq = merge_similar_words(INPUT_FILE_PATH)
filtered_word_freq = {word: freq for word, freq in merged_word_freq.items() if freq >= FREQUENCY_THRESHOLD}
sorted_word_freq = dict(sorted(filtered_word_freq.items(), key=lambda item: item[1], reverse=True))

######################################################################

write_to_csv(OUTPUT_FILE_PATH, sorted_word_freq)
print(f"Merged and sorted word frequency data has been written to {OUTPUT_FILE_PATH}")
The table below is the sorted table of suggested services based on the frequency of repetition of keywords tagged to each service:
| Recommended Service Title | Keywords (translated to English) | Frequency |
|---|---|---|
| Ad information Completion | Price, How Much?, Size?, New, Color, Model, Size, Centimeter, Material, Height, Photo | 1016 |
| Product more details view (PDP) | Size?, New, Color, Quality, Model, Available?, Black, Centimeter | 873 |
| Payment (or earnest money) | Price, Discount, Toman, Money, Deposit, Card, Cost, Earnest Money, How Much?, Bill | 693 |
| Product Delivery | Delivery, Address, Post, Transmission, Order, City, Home, Fare | 414 |
| Contact the seller or buyer | Number, Contact, Phone | 410 |
| Photo Selection (OS API) | Photo, Gallery | 320 |
| Navigation | Address, In-Person, Where?, City, Town, House, Passage | 255 |
| Audio to text conversion | voice | 21 |
Evaluation
After we implemented and functionally tested one or more of these suggested services and finally released them, We have to montitor them. We can do a series of qualitative and quantitative work to evaluate feature adoption:
Quantitative work: in order to know whether the released service is working properly or not, we can deal a bit with data! This is both from a technical point of view (for example, check
SentryLog orCrashlyticsto see if the system is stable or not) and from a product and business point of view. For example, do some CRO (conversion rate optimization) to see how much drop we have on each funnel in the considered journey(s) and Those who have a drop that doesn’t fit with reason, what is the reason (we have to combine it with the qualitative work that I will say below). The survey is also the answer for those who went to the end of the funnel. Of course, there is a challenge because here we are dealing with external services and we don’t have any data about their funnels either. As a result, we have to have continuous interaction with them here.Qualititative work: In the previous part, when we came to the conclusion that a funnel is not working well, here it comes the qualititative work.We have to take out a sample of those who got stuck in each funnel and see what was their pain that got them stuck. Or at all, those who we showed the options to but did not use, we have to ask them what was the reason.
The evaluation output should become a series of actions to take and improve the product in next iterations.
Leave a Comment